 Exposing the lack of compassion by conservatives and
debunking right wing hypocrisy at every opportunity.


I've been looking around at other ways to visualize the election (again), and came across a BBC US Election Map Generator they use to describe our freakish electoral college system to a nation that still picks their sovereign head of state in a much more refined and old fashioned way, via funeral and coronation.
The map does what my cartograms attempt, which is show the relative power of various states in the electoral college. They do it by animating the elevation of a state (very cool on the site in some kind of flash animation I can't seem to replicate or embed). They do it in stages, the last one I reproduced here with the final results shaded the appropriate red and blue according to the latest results at 538.com.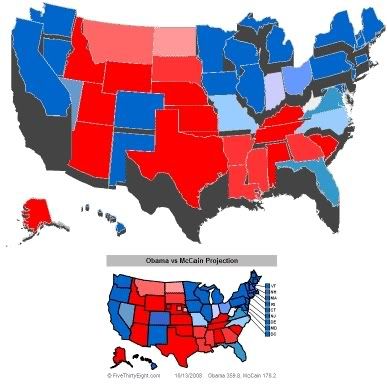
Well, with Obama scoring a stupid lead in the CBS/New York Times poll (plus 14 really is just running up the score folks, that's two touchdowns and we usually score political matchups like hockey); I figured it was time to show just what vintage 1979 video game technology could do with my version of an election map. To my suprise, it stood everything on end and the blue representing Barack Obama's immenent landslide swallowed everything in sight.
So here it is, the state of the 2008 election according to Atari: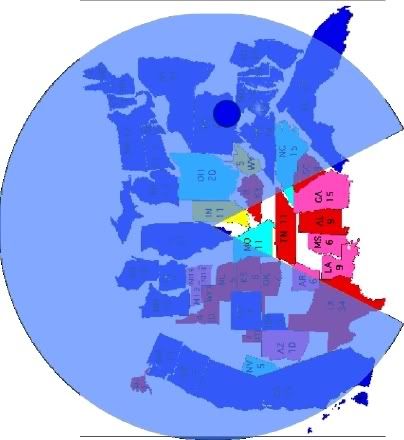
10/14/08
| [+/-] |
Atari's Electoral Cartogram Generator |

10/2/08
| [+/-] |
hey, Where da Maps Go? |
Feel Good News Of The Day, via Electoral-Vote.com
- Battleground (Obama +2)
- CBS (Obama +9)
- Diageo (Obama +5)
- Gallup (Obama +4)
- GfK/Roper (Obama +7)
- Ipsos (Obama +3)
- Opinion Research (Obama +7)
- Pew (Obama +6)
- Rasmussen (Obama +6)
- Research 2000 (Obama +10)
And the all important electoral College Count:
Obama 338 McCain 185 Ties 15

States drawn to reflect relative strength in the Electoral College and polling gathered by EV.Com.
Electoral Votes.Com (Obama +153) Obama 338, McCain 185, Toss Ups 15.
FiveThirtyEight.com (Obama +134) Obama at 336 to McCain's 202.
Pollster.com (Obama +87) Obama 250, McCain 163, Toss Ups 125.
RCP (Obama +168) Obama 353, McCain 185 (typo corrected)
Update: Note that Nate might be a little presumptuous in this critique of Real Clear Politics. I too find RCP's editorial policy a bit too right wing for my taste, but when their numbers look almost identical to Electoral Vote.com I think their methodology is as sound and unbiased as anyone else's.
9/5/08
| [+/-] |
Electoral Map and Crayons |

States again are drawn with their size relative to their votes in the Electoral College.
Obama is down 14 Electoral votes from my map last week, and McCain is up three. Throughout August Obama had just enough or not quite enough to win it all, now back down under the 270 vote threshold like he was three weeks ago. Again for the fourth straight week, McCain's overall performance has improved slightly, but he has a tremendous amount of ground to make up doiing it one 3-vote state at a time while Obama retains a huge lead, still +75 votes.
At this rate McCain might overtake Obama, but not for a year or two. More significantly, the fallout from the conventions is just starting to appear in the state-by-state polling. All partisans of any stripe must agree that the Democrats put on a show that was the height of presidential perfection, and it looked like Jerry Springer ran the GOP festivities. That should be reflected shortly.
First, the Electoral College Scoreboard from the Polling Aggregators:
RealClearPolitics: O-238 / M-185 / TU-115 / Obama +53
RealClearPolitics W/O Toss-Ups: O-273 / M-265 / Obama +8
Pollster.com: O-260 / M-179 / TU-99 / Obama +81
Electoral-Vote.com: O-301 / M-224 / TU-13 / Obama +77
FiveThirtyeight.com: O-310.6 / M-227.4 / Obama +83.2
Sadly, Alaska I fear is hopelessly red now with Yukon/Caribou Barbie on the GOP ticket. (I wonder when Palin will ask McCain to switch places?) The good news is that we are a long way from reading the last election related story from the Northern Frontier. New polling up there is a bloodbath swinging towards the McPalin team and the GOP right down the line, even helping the despicable Ted Stevens who got a huge boost. Palin is still polling in the 80s for approval and the announcement of her as McCain's Veep has shook up their world.
Note the more (ahem) conservative "rolling average" approach of RCP in awarding close/toss-up states seems to favor John McCain more than Obama. They are only holding back a decision on 16 more EVs than Pollster.com, RCP counting MI and NM as toss-up where Pollster has them colored blue, but RCP puts ND and MT in McCain's column which are considered toss-ups at Pollster.
PCM Toss-ups - NV NH OH VA NC FL CO ND MT
RCP Toss-ups - NV NH OH VA NC FL CO MI NM
538.com of course forces toss-ups one way or the other and uses a weighted average of all polling, counting older polls less and looking at the track record of the various outfits ringing the phones. Their 83.2 EV advantage for Obama is quite the landslide any way you count it. Pollster analyzes trend lines and also shows an 81 EV route.
Good old Electoral-Vote.com simply uses the latest poll, averaging polls done within a week of each other, which can make it the most volatile yet up-to-date tracker. However, even though they use a similar methodology as RCP for awarding states in the strong/leaning/tie categories, their addition of a third "barely" group explains why only Virginia's 13 EVs show up in their calculations as "exactly tied."
So what about OHIO OHIO OHIO?
CNN/Time and Quinnipiac both have very recent polls that give Obama a slight one point edge in the Buckeye State (a statistical tie of course) that is enough to flip it a light shade of blue in every aggregator but RCP -- which includes a pre-conventions Rasmussen poll (who have consistently favored McCain in Ohio by a far bigger margin than anyone else) that had the GOP contenders up 5 points, plus one of those goofy Columbus Dispatch mail-in polls in their survey average. Thus according to RCP, and only RCP, Ground Zero of the battleground states is an ugly red when leaners are pushed. It's blue or toss-up state everywhere else, just. I'm calling it a tie for now.
Older Rasmussen data (McCain +1) also explains RCP pushing Virgina into the Republican column in their no toss-up map even though the most recent polling there, a day before Joe Biden joined the Obama campaign, is from PPP which has Obama up by 2 -- a three point swing with corresponding trends affecting Pollster and which should be reflected in the 538 weighted approach (but isn't). You'd think E-V would be reporting Obama up 2 per the PPP poll instead of being the only dead heat on their map, but from the way they present their data (in graphic form only) I can't tell if they even included PPP in their VA analysis -- which means they're going by Rassumussen and calling a less than one percent fraction a true tie instead of rounding -- which explains reporting the VA Rasmussen poll a one pointer for McCain everywhere else.
Some miscellaneous changes I include are Nevada from lean Obama to toss-up with the latest CNN poll (pdf) showing a true tie when independent candidates are on the ballot (Nader getting 6%, Barr 5% and McKinney 3%). Obama wins by 5% of registered voters if it's just between him and McCain. Look out for the spoiler effect in this most unlikely state.
I'm a bit leery to change North Dakota to light blue even though the only polling there in the month of August had Obama up by 3 came out right in the middle of the Democratic Convention. It's North Dakota. It should be an automatic red state. That fact that it's in play is fantastic, but SaraCudda's Anne Oakley impersonation should be enough to keep it slightly red unless Obama puts some cash in there to steal those 3 EVs.
Pennsylvania is now firmly an Obama state as far as I'm concerned. Every August poll has him ahead by a comfortable margin, averaging a lead of over 6 points and only below the margin of error in one poll. The Dems are spending a lot of time and money there to shore up the lead. Tom Ridge alone won't turn things around all by himself and unlike Obama and his Scranton, PA native running mate who are crisscrossing the state, the McCain camp seems to be ignoring it. Of course the wrinkly old guy and his sidekick the hockey mom are starting out in Michigan (where the Dem advantage isn't so great) and Wisconsin where the GOP is losing by double digits in one poll, so who really knows if they even have a strategy. None was apparent judging by the last week's soap opera.
Colorado is a real mixed bag on all the aggregators, ranging from slightly favoring Obama to toss-up, yet the last poll there was taken at the start of the Denver convention, a three day survey period by CNN/Time whose midpoint was the day of the Biden selection showing McCain up by one. I'm pretty confident once the post convention polling comes in, it will go back to blue, but it's a toss-up for now.
Florida is still a surprising toss-up. I was all ready to paint the Sunshine state red on the strength of six straight August polls showing a steady rise in McCain's popularity -- until the last one by Mason-Dixon taken as things got started in Denver, erasing what had become a 7 point McCain advantage from Strategic Vision to a one point squeaker in Obama's favor in one day -- the day Biden got picked. Other than Alaska I don't know where Palin will play (they hope Ohio), but no doubt Biden is a game changer too, at least in Florida. I think the Delaware Senator needs to work on his tan this fall.
That should do it for this week in trying to stay inside the lines while I color in the map. Next week should be interesting as more polling reflects the full impact of the Democratic Convention and the first reactions to the GOP Convention and Sarah Palin -- and what the public thinks about McCain's judgment in picking her. I imagine things will pretty much settle out in about two weeks and barring the nearly inevitable October Surprise, we should have a good feel for where we're going and what needs to be done. As of now, just as it was when we started these up at a month ago it's Obama's race to lose.
8/29/08
| [+/-] |
This Week In Electoral Cartography |

I'm taking Minnesota off the dime and putting it fully in Obama’s corner this week. RCP still puts the Gopher State as a toss-up with Obama up by 4.5%, but it’s clear with Electoral-Vote.com putting him up 47%-42% in a state that was carried by the Dems every election since Reagan's '84 landslide (not even Nixon could take it) and Pollster.com's trend estimate showing the Democrat with a 7.5% lead there -- plus FiveThirtyEight.com's list of all the Minnesota polls throughout the summer show Obama leading every time concluding that McCain only has a 17% chance of taking those 10 electoral votes as things stand right now.
Mind you, this could all change since the GOP enjoys the home field advantage with their upcoming convention in the Twin Cities, it's nonetheless long odds. So color the MN map blue for now.
Note there's no post-convention Obama bounce reflected in any of the state-by-state analysis yet. Only the national trends are indicating an uptick in the Illinois Senator's numbers that can be correlated directly to this last week's festivities since there isn't really enough individual statedata to go by. The FL, OH NC, PA and Tx polls announced Tuesday, 8/26, and CO, FL, NM, NV, PA and RI Wednesday 8/27 can only show us a baseline where the candidates started out immediately on the heels of the Biden for VP announcement, but before the full effect of Obama's remarkable acceptance speech could sink in.
There is enough in those polls to take out the crayons again, even if it's too early to tie the new blue found in Nevada directly to anything that came out of Denver. Changing Colorado from yellow to blue no doubt has something to do with the invasion of Democrats there this week which, unlike Minnesota, has been a true battleground right along. Pollster.com's trend methodology doesn't lend itself to quick movement of a state from one column to another, but 538 and E-V switched CO and NV to Obama -- barely. Swinging barely the other way are Montana and the Dakotas, but really, who cares?
More interesting is the new colors for the Carolinas which are moving in opposite directions. A troubling trend in Ohio and Pennsylvania moves Ohio back to "pick 'em" and Pennsylvania displaying weaker support for the Democrat but still in his pocket. Here's where I'm hoping an enduring bounce will erupt.
Just my informed guestimate, but the combination of Thursday night with McCain's inexplicable selection of Alaska Governor Sarah Palin will not only move undecideds to Obama, but push the PUMAs away from McCain. This is a transparent pander to disaffected Clinton supporters who are way smarter than the Rovellians understand -- it's beyond insulting. Offering a token substitution to supporters of the single best female politician of the age with a GILF known as Ameirca's Hottest Governor, who stands for everything Hillary isn't just won't cut it. Again the GOP uses smoke and mirrors, convinced you and I are just plain dumb. Palin's experience as a part-time mayor and being brand new on the job as Governor of a state wracked by Republican corruption can't hold a candle to Hillary's qualifications even before she moved into the East Wing of the White House.
To my eye, we now know McCain is simply not serious about the job he's applying for and has delivered tepid supporters with a less tribal sense of GOP party loyalty yet another excuse to sit this thing out. McCain is too fearful of losing his die-hard conservative base to ever again deserve the maverick reputation he spent a lifetime nurturing.
Is their bench really so shallow they put up a yet another politician being investigated for corruption by her own party, alleged to have used her political clout to get her ex-brother-in-law fired?
Yet for all that, I'm still keeping Alaska in the toss-up category, dammit. But look for it to turn blue next week with Ted Stevens still rolling along, having won his primary and energizing the Democrats who should be noticed in the Anchorage Press's poll due soon. Unfortunately it will be a short-lived victory once the pick of the popular Palin is put in the mix. Alaska is no longer in play.
8/22/08
| [+/-] |
August Arithmetic |


(As usual, the size of the state reflects it's votes in the Electoral College)
More than a couple of folks have pointed out to me that (gloated, actually) that my map of the electoral college needs tweaked again -- and it ain't as rosy as it has been for Senator Obama even though there's no news from the race that captured my imagination in Alaska. It's still a toss-up as far as the data I have right now, but soon to change. Soon.
Most of the pollsters show significant movement in key states, cutting into Obama's electoral lead enough now that he either is winning but no longer has the magic number 270 in his pocket, or is still winning but just barely has over 270, his comfort margin evaporated.
Everything will change as the polls start reflecting his VP choice.
Everything will change as the polls reflect the public's reaction to the Democratic Convention.
Everything will change when McCain announces his VP and after their convention.
Everything always changes in August.
Four years ago at Electoral Vote Predictor, Kerry was winning 317-202 on August 18th, slipping to 286-233 by August 22nd, and losing 242-280 by August 31st. By the time it was all over, it was Bush 286 - Kerry 252.
What's different? The Democrat's August slide took place well after the convention last time around. Edwards was picked on July 6th and the convention took place at the end of the month. Kerry enjoyed a month-long bounce, which started to wane just as the GOP Convention took place from August 30 to September 2. Kerry couldn't catch another wave.
The dynamics of the calendar couldn't be different this time around. Obama will be in full bounce mode and on the upswing with the attention on his team overshadowing the GOP's festivities in Minneapolis. This time there will be competing bounces -- possibly canceling each other out. But McCain won't be able to surge alone like Bush did after his convention sucked the air out of the media.
Momentum means a lot in these things, since so very often perception is reality in politics.
So where are we today? RCP has (predictably) the map drawn in the worst possible light for Obama, 228 to McCain's 174 with 136 toss-ups. With leaners pushed over the edge, their map gives the edge to McCain, 274 to Obama's 264, but they still have Obama up by 1.4% nationwide which is less than even FOX that shows Obama +3.
Rasmussen Reports Obama +2, and despite what seems to be ominous tiding from CNN, Rasmussen is impressed by the "amazing stability" of the contest with Obama still up 264 to 247 with a 58% chance of winning according to their market data.
The current Electoral Vote Predictor has Obama just under the magic number, polling in at 269 electoral votes (tie territory) and M.cCain an improving 256. Pollster.com puts 87 votes in the toss-up column, but still gives Obama 260 to McCain's at a dismal 191, but better than last week when Obama dominated.
FiveThirtyEight.com colors the map bluer than the others and still shows Obama winning outright, 273.7 to 264.3 even with Ohio an ugly shade of red instead of the toss-up color on the other site's maps (and where I put it since as I explained in previous posts, the Ohio numbers are skewed by an outlier poll). BTW, Nate's take on the VP choice is spot on. The clock favors Biden and Clinton, and ticks more her way with every minute.
So what changed? North Dakota is now a toss-up instead of leaning McCain, which in my opinion is horrible news for the GOP. Obama-mentum is moving west. McCain is barely up by 3 points in a state Republicans have won overwhelmingly since the 80s. No excuse, not even the usual non-sequitur that McCain is a POW explains this.
Inexplicably, Arizona is also moving away from McCain, but he's still safe enough in his home state not to worry too much just yet. Arkansas has also moved from deep red to merely leaning McCain, and could become a true battleground state if a certain New York Senator and favorite daughter is on the Dem ticket.
Moving in the wrong direction are New Hampshire and Minnesota, now true toss-ups at Pollster with Obama leading by just a point or two on the heels of new numbers from ARG and Rasmussen in New Hampshire and doing just slightly better in Minnesota unless you count the MPR poll, which was in the field for two weeks which makes the value of it's Obama +10 conclusion a bit suspect.
Finally, Indiana is shoring up for McCain who went from a one-point dog a month ago to a 6 point winner according to Survey USA. But since Evan Bayh couldn't deliver Indiana for Clinton, I don't expect him to be counted on to deliver it for Obama. I don't think Biden helps Obama there, but Hillary helps Obama everywhere -- and maybe then the damn PUMAs will get over themselves.
The big winner this week: Toss-Up +20! McCain is +19 from last week and Obama is -14 after two full weeks campaigning in Europe and vacationing in Hawaii. This thing is about to get real dynamic in the next couple of weeks.
8/16/08
| [+/-] |
McCain Moving Up Or Pollsters Playing Around? |


Note to Obama: Don't take the bait and play in the sludge with Exxon John. His only hope is to bring you down because even if he had been running an "honorable" campaign, his best case scenario still loses unless he can steal a significant amount of your support. McCain can't win by building himself up alone. He must bring Obama down to prevent a Democratic tsunami.
When's the last time we had a President smart enough to be president of the Harvard Law Review and not just swear to "preserve, protect and defend the Constitution of the United States," but also teach what the Constitution means. I don't even think the current Resident has even read the thing. Obama winning is a very good thing.
You'll notice some movement in McCain's direction if you've been
following along. don't be alarmed. It's as more about how I'm
allocating close races than anything McCain has done (or anywhere he's
threatened to bomb). Note that Obama's numbers are still rock solid
and he's got a cushion of 14 electoral votes while even in this latest
map, McCain's best so far, he needs 98 more electors with only 82
available in "Toss-Up" states.
Rather than flip a coin or roll a 12-sided dice to decide which of the three polling aggregaters I'd rather rely on between the very different projections Real Clear Politics, Pollster.com and FiveThirtyEight.com present, I did what pollsters do and averaged their results, matched that with the closest fit and ran the numbers to show you how I wanted you to see the world.
I really like the look, the color scheme of Pollster.com, and their interface is superb. You can tell at a glance the state of the race and you can delve into the details with ease just by mousing over what you want to see -- a click takes you deeper inside the numbers and graphs. I also like their trend analysis since it's simple and something a non-statistician can grasp. 538 uses a much more sophisticated method of analyzing and weighing polls to project the outcome, and while it probably is highly accurate you can't tear the conclusions apart to see where they came from like the other sites. But they put a ton of info on one page.
That leaves RCP who's editorial preferences are not my cup of tea, and they're way too stingy when it comes to awarding a state to one or the other candidates (ie. they have Obama +7.2 in Wisconsin, but it only "leans" his way). However they do attempt to do what you're supposed to do with these things, provide a snap-shot of the current state of the race and not necessarily predict the future. That's what all polls really are, at least according to all the pollsters who simply can't resist the temptation to predict rather than merely report, despite their best intentions.
RCP w/147 toss-ups: Obama +65
RCP w/o toss-ups: Obama +70
538.com, no toss-ups: Obama +34.4
Pollster, 85 toss-ups: Obama +115
Both of RCP's electoral vote counts are close to the average of all the aggregaters, so I used their numbers as a tie-breaker between the other two when there's no clear consensus on a particular State. Interestingly enough, RCP's "rolling average" and their simple division of leaners vs. strong states based on whether a candidate has more than a 10 point lead seems arbitrary compared to the "confidence interval" methodology 538 and Pollster use. But since these more professional polling annalists come up with a radically different spread in the electoral count, I'll go with the "less is more" theory that RCP uses when in doubt if it seems reasonable.
It's that or resort to a modified version of the Keith Number since I have questions about all three sites' category selections processes. RCP's rolling average has no scientific value. 538 uses a weighted method that handles the age of a poll in a unique and intuitive manner, but also weighs each polling firm by their reputation and reliability, a completely subjective way to analyze any particular data point offered by professional polling firms.
Pollster is chalk full of professional analysts, and I can't fault their methodology. It's what they're trying to show I have a problem with. I don't necessarily want to know what the "trends" are "telling us" will happen later on. I want to know what it says now, period. I don't particularly trust crystal balls.
I know that explanation of polls can make a lot of people's eyes glaze over, but in a nutshell that's how I decided to make North Dakota and N.Carolina pink and put Arkansas safely in McCain's red zone. The other two sites didn't agree with Pollster.com, where I was getting my original data. Majority wins -- except in Alaska where only Pollster is using the Hays/IBEW poll that has Obama ahead and the Anchorage Press poll of the other state-wide races this week paints a picture of a near total collapse of the corrupt GOP machine there. Some new AK polls will be out in the next week or so for the presidential contest. AK stays yellow despite what the experts say because I think it'll be turning light blue by next month. It's wide open on the last frontier.
For anyone who's interested in Ohio (and aren't we all) RCP and 538 have the race as a toss up although Pollster (and me) rate this as leaning Obama. Here's where trends can eliminate the number-bomb an outlier poll can cause to a spreadsheet. Rassmussen put out a poll on July 21st with McCain 10 points ahead, an 8 point jump from their own numbers from the previous month and 12 points off a PPP poll that came out the same week which had Obama leading by 8. Obama was up by 2 in a Quinnipiac survey in the same time frame.
Obama's numbers stayed steady in the two Ohio Rassmussen polls from June and July, so McCain wasn't gaining any strength due to Buckeye fans falling out of love with him, which is almost required nation-wide. There is no way Maverick Man convinces all the fence sitters to fall his way while Obama holds all of his followers even if McCain rips Cindy's shirt off and rides a Harley over a shark tank.
When RCP averages the last three polls and 538 assigns greater weight to more recent polls even though they came out within a couple of days of each other, an outlier poll swings all the numbers wildly when everything's averaged together. Pollster's graphic representation of the trend lines tell a better story in this, case accounting for the outlier but keeping the big picture in mind.

Again, for those who haven't seen my state-by-state electoral maps (cartograms), the size of each state is drawn to indicate the number of votes each gets in the Electoral College.
8/15/08
| [+/-] |
Friday Map Blogging |

Good and bad news from Pollster.com today. The good news is that they've moved the national polling trend line from "Toss-Up" to "Lean Obama." McCain's numbers look like a flat-line on a heart monitor, stuck at 42.3% on the trend line with Obama +2.6 at 44.9%.
Accessing pretty much the same data, Real Clear Politics has Obama up by a bit more, +3.5 but the percentages are similar. But as we all know by now, (class, are you paying attention?) it's all about the electoral college map.
Getting to the bad news from Pollster.com. They've moved yet another state McCain's way, changing North Carolina from Toss-Up to Lean McCain. Michigan too is moving in the wrong direction, now just a Lean Obama state instead of strongly in Barack's corner.
I trust none of this news is earth shattering. It certainly isn't to 538.com, who had Michigan there for some time. RCP lists Michigan as a true Toss-Up on their map. They also put Ohio in the No F-ing Clue category but doesn't take the bait on the North Carolina that moved it to deep red at 538.com who note Rassmussen now has NC safely in the GOP's column at +6.
Here's the horse race for the electors:
RCP w/147 toss-ups: Obama +65
RCP w/o toss-ups: Obama +70
538.com, no toss-ups: Obama +34.4
Pollster, 85 toss-ups: Obama +115
I'm going to delve some more into the numbers and play with my cartograms some more and should have something neat to oogle, or Google, tonight or tomorrow morning. Bottom line, however, barring something catastrophic this thing is still Obama's election to lose.
| [+/-] |
Battle For Red Neck Ohio |
 Hard to tell if Karl Rove is just blowing smoke or full of crap sometimes. Maybe it's just wishful thinking that he thinks John McCain can be competitive in the traditionally Democratic regions of Ohio.
Turd Blossom's Wall Street Journal column got my attention yesterday, not just for delving into my home State's presidential preferences, but because he specifically mentions four areas I've lived in by name.
See the dark blue counties on the map, the ones that went for Kerry last time around by a two-to-one margin? That's where I come from -- veritable fortresses of liberals under siege by the red Republican menace.
I grew up in the Mahoning Valley just north of Youngstown, went to college in Athens, that lonely blue county in the southeast, lived in suburban Cleveland 15 years after that. Now I blog from Toledo.
This could be the reason I simply can't relate to the red-necks who populate the rest of the State. I have to travel through Amish Country to see conservatives in their natural habitat. It's like visiting a foreign country. I've live in this State my whole life, but the cranial wiring of the average wingnut is simply a mystery to me from lack of exposure.
(And yes, I said red-neck. If you're offended, you might just be a red-neck. See Jeff Foxworthy for further clues.)
When you read Karl Rove's take on the Buckeye State, keep in mind that if only about 60,000 Ohio voters had switched (or been counted fairly), Kerry would have won in '04 -- thanks to my five "home" counties.
Heh. McCain has ZERO appeal to the folks who've watched the manufacturing foundation of Ohio, centered in the northeast and along Lake Erie's coast, systematically destroyed through the conservative brand of economic mismanagement.Then there is Ohio. Ground zero in '04, its 20 electoral votes will be hotly contested again this year. No Republican has won the White House without winning the Buckeye State.
How can Mr. McCain take Ohio? He can appeal to swing voters in the northeastern part of the state. Cuyahoga, Summit and Lucas counties and the Mahoning Valley are full of culturally conservative, working-class voters. In addition, Mr. Obama was wiped out in the primary among the blue-collar Reagan Democrats of southeastern Ohio. Outside of the university town of Athens, he won less than 30% of the vote in southeastern Ohio. This Appalachian region remains bad turf for him.
Mr. McCain will need to do well with suburban independents in the counties surrounding Columbus to balance heavy African-American turnout. He will also need to run strong in the Cincinnati suburbs in the southwest, and in rural and small-town counties.
I've decided. Karl Rove is full of crap.
Oh sure, you can find your fair share of "culturally conservative, working-class voters" in those deep blue areas, (which is Rovellian for red-necks). That's why I sell so much more Budweiser than Guinness or wine spritzers (whatever those are). However, other than the bastion of enlightenment where I got my bachelor's degree, the deep blue counties are also union towns, run by Democrats, who run against other Democrats on ballots which include Republican picks mainly for comic relief and as a third party protest alternative.
Northern Ohio is a virtual lock for Obama. At least now that Blackwell isn't out there to rig things and our new Secretary of State has had no problems firing corrupt GOP party bosses sitting like feudal lords at the local Boards of Elections throughout the state. That's my hope anyway. Either way it's probably not Karl's fault he's so, um ... misinformed. It's not "The Math." It's the maps.
As usual, the maps are misleading. The one above comes right from Ohio's largest fishwrap, The Cleveland Plain Dealer, which also has similar maps of how Ohio voted in every presidential election since 1960, color-coded county-by-county. All of them are very interesting, yet would give you the wrong impression because just like the national maps, there's just too much red to account for a close race. Just five blue counties against that sea of red? How is that close?
 Here's a better view of what's going on in Ohio. I've charted the number of voters from each of Ohio's 88 counties and assembled a new Ohio Electoral Cartogram that more accurately tracks people instead of real estate, The color scheme is the same as those from the first map above.
Different world, no? If it's bang for the buck Rove is looking for, going on the air in Northern Ohio makes a certain amount of sense. The traditional maps do give you a good sense of what's happening in the media markets, since TV and Radio signals only go so far. But it doesn't explain why there's an island of red in the northeast. Geauga and Lake Counties are not isolated from the Youngstown and Cleveland media reach -- indeed they overlap there.
In fact, they get a little bleed over from light blue Akron as well. But note the correlation of counties that are not included in any media market to all the red hued Bush counties. These people may be ill or under-informed about the rest of the world.
No, it's even weirder, weird if you consider living without electricity, let alone modern telecommunications is weird. Did I mention the Amish? Horse and buggies really do rule the road in Lake and Geauga Counties. Quaint, great cheese, pretty good wine, and hopelessly backwards. Just the place to find McCain supporters, the whole home-skool'd lot of them.

This thing is kinda like playing Tetris when you try and fit it together. Cuyahoga County is the biggest blue blob in my cartogram with 100 little squares. The size of all the other counties is the ratio of total voters who cast ballots in that county's 2004 election according to CNN's reporting. Each square in the other counties represents one percent of Cuyahoga's turnout, fractions rounded and all counties get at least one square even if their turnout was embarrassingly small.
With the Taft/Blackwell/Dewine machine thoroughly disgraced and out of power, I seriously doubt McCain will be able to win their power center in Cincinnati. (Hamilton County is that light pink blob in the lower left of the first two cartograms, colored an unlikely shade of dark blue by the wiki in the media market map.) But it's no coincidence that the blank spots in the media coverage map correlate all too well to the deepest red of Ohio's voting patterns.
Ohio is a much bigger problem for Democratic outreach than the GOP at this time, at least using traditional broadcast media. Much like they did in Texas, the GOP built up party identity in red neck Ohio through churches, direct-mail and phone-banking. Despite the catastrophe that is the Bush years, their infrastructure remains in the rural counties where God, Guns and Gays still rule, and satellite TV is still considered "fancy."
But this here new-fangled internet thingy seems to be catching on. Nothing, and I mean nothing gives you cost effective message distribution better than the web.
Again, the conservatives' inclination to spread viral lies through e-mail is some years ahead of us. I remember being on list servers and one of about 80 recipients when my mail box filled with headers that read, "Fwd: Re: Fwd: RE: Fwd: Fwd: Re: Re: Re: Fwd: Re: Fwd: Re: Re: Re: Bill Clinton Killed Vince Foster." Those lists still survive, and in the days of high speed access, YouTube and 24/7 cable news, it's very easy to forget that a lot of folks don't get cable and still rely on dial-up -- but they vote. Those areas still get old fashioned email, and snail mail, and are red, red, red, right up to their necks.
There's a lot at stake this time around as you all know. One thing you can do to Fight The Smears is hit your own forward button every chance you get, and maybe enough of it will filter around, turning red to blue one neck at a time. Open up your address book and tell everyone on your lists that:
- Recent viral emails quote Barack Obama's books out of context
- The independent group, Factcheck.org, concludes that the smear email about Barack Obama and taxes is “a pack of lies.”
- Barack Obama’s campaign plane does, in fact, display the American flag on the outside fuselage of the plane.
- Barack Obama’s campaign canceled an originally private visit (no media) to wounded troops in Germany to avoid politicizing our soldiers during his campaign-funded trip in Germany.
- Barack Obama spent time throughout his foreign trip visiting with and thanking our troops.
- Michelle Obama loves the United States and the opportunities it has given her. Even Laura Bush has defended her comments – watch the video.
- The (Whitey) tape that Rush and others are spreading rumors about doesn't exist.
- Barack Obama has made his birth certificate public and it can be seen here.
- Senator Obama is a committed Christian. He has never been Muslim, and was not raised in that faith.
- Barack Obama loves his flag and his country. Watch a video of Barack leading The Pledge of Allegiance in the United States Senate, with his hand over his heart.
Now get busy.
8/13/08
| [+/-] |
Electoral College Cartograms Update |


Alaska is trending in Obama's direction and is an unfamiliar shade of yellow, no doubt due to the corruption saturation in the State's Republican Crime Syndicate. Obama is up 45% to 40% for McCain in the latest survey. In every previous poll, McCain was leading.
Pollster.com now has AK as a true Toss-Up with Obama 5 points ahead upon the heels of a poll from Hays Research (funded by the Democratic leaning IBEW Union). Looking at the numbers, Obama is consistently polling between 41% to 44% in other Alaska polls and McCain has been in the 44%-51% range. This one still has Obama in the mid 40s, just one point higher than usual. The 5 to 10 point crash in McCain's support, however, is dramatic. Note that Ralph Nader was included in this poll, but at 1.5%, he's a non-factor. It's a small sample poll, only 400 "Adults" (not screened for likely or registered voters). This could be an outliers as far as I'm concerned, but the experts at Pollster.com think it's enough to trend the race there as a dead heat.
Realistically a trend move from "Lean McCain" to "Toss-Up" in a State only boasting 3 electoral votes is rather insignificant, but it's nice to see a little less red on the maps, especially the ones the "old media" uses which shrink it to fit in a corner yet still draw Alaska bigger than Ohio and so many other states that have so much more influence on the numbers that really count. Perhaps this might make them start acknowledging what the pollsters, and even Karl Rove already know: this thing ain't even close right now.
McCain must shore up all those pink states that lean his way, capture every single toss-up state and take either Ohio or three of the four other states that are in the lean Obama category. We still got a ways to go, and all the usual caveats apply to polling analysis, but if you look at another polling aggregator, FiveThirtyEight.com (who doesn't do toss-ups and considers the Hays Alaska Poll an internal Democratic poll and won't include it in his analysis, keeping AK red for now) has Obama winning the Electoral College 65.4% to 34.7% (299-238) while only winning the popular vote nationwide by 2 points, showing how a small popular vote margin translates into an electoral tsunami.
(If you're wondering about the weird looking map above, the relative size of each state has been enlarged or shrunk to reflect their influence on the electoral college. Click for previous versions and some different representations as well as a better explanation and analysis.)
8/11/08
| [+/-] |
Electoral College Cartograms R Us |

Again, I'm in debt to Pollster.com and Dr. Sara Fabrikant.
John McCain's support in Texas moved from "lean" to"strong" this week according to Pollster.com's trend analysis, shoring up his base support but not significantly moving any electoral trends away from Obama. Arizona, however, did move from the "toss-up" column I had it in last week to "strong" McCain. A big jump but hardly an unexpected development for the Arizona Senator to poll well at home. This was influenced by two new polls at the end of last month. Mississippi also trended from "lean" to "stong" McCain -- hardly an earth-shattering development.
Of concern is Pollster moving Oregon from "strong" Obama to "lean" Obama and no notable movement in the other direction anywhere else. The democrat still enjoys a 6.4% lead in Oregon according their the trend estimate of all polls, but has taken a downward swing on the latest Survey USA poll that only had him up by 3 points among likely Oregon voters.
Last week, looking at my map of the relative size of the states as a function of their electoral vote count, color-coded red and blue and shaded to indicate the depth of support for either candidate, it seemed clear why the McCain camp went so negative over the last several weeks. Looking at today's map, with the incremental movement of the polls rewarding that decision, expect a ton of the same lies and smears from the GOP right up through September.
Any data that comes out before the conventions that doesn't fit with their new paradigm will simply be dismissed by the punditocracy as people paying more attention to the Olympics, or an Obama bounce from the Denver convention. If (as I hope is the case) Obama surges in the polls and McCain does not change his strategy, opting to concentrate on trivialities and personality instead of promoting any real solution for the problems that plague the nation, by the time he doesn't realize any comparable post convention bounce to bring him to parity with Obama it will almost be too late. They will be prepping for debates and increasingly desperate, refusing to acknowledge that gutter politics undermines the only thing McCain really had going for him, his reputation for integrity, which has now been exposed as non-existent.
So the map is a big redder, but not any less blue this week. The reaction I usually get from folks is that these things just look weird. All squashed and stuff, but it makes them see the country in a new way. A notable exception is my map-maker college buddy, who diggs the hell out of them.
I think one of the reasons the thing looks strange at first blush is the morphing of the state borders. Dr. Fabrikant takes care to keep the integrity of each state's position in relation to the others, all boundaries correct and intact. However the "squashing" and "ballooning" necessary to indicate each state's relative electoral vote distorts the individual states beyond recognition, leaving too many "blobs."
I decided to try my hand at the concept, retaining the integrity each individual state's actual shape while distorting it's size relative to the number of electors they send to select the president, while sacrificing their borders with each other. The result is kind of like taking a couple of children's puzzles of the states, of differing sizes. They will never match up correctly, but you can tell exactly which state is which if you are familiar enough with their shapes. I used the same color scheme as above to represent the relative strength of support the candidates claim according to the trend analysis at Pollster.com.

What I like about this map is that the states are all instantly recognizable. Idaho, Louisiana, Maryland and New Jersey look like what we're used to. Alaska looks small, it's not where it's supposed to be, but you can tell it has the same amount of power when it comes to electing the president as other "little-big states" like the Dakotas or Wyoming.
I also like the fact that Alaska looks like Alaska and not something you'd scrape off the bottom of your shoe. You can tell which states are supposed to be Kentucky and Tennessee instead of just a elongated blog. Washington DC looks just about as big and important as Rhode Island, Vermont or Maine, adding to the northeastern sea of blue (even though it looks like it's floating in the ocean between New York and Pennsylvania instead of nestled in between Virginia and Maryland where it would otherwise hopelessly distort the entire east coast.
A potential for confusion does pops up pretty quickly. It could be easy to mistake the four little states that on most maps take up about 20% of the real estate, and think that where I have Montana, Wyoming, North and South Dakota (below Minnesota, to the right of California) are instead the "Four Corners" states of Utah, Arizona, New Mexico and Colorado whose corners do not touch in this representation. I'll probably play around with that in future posts.
This may seem a silly exercise. However, if it serves to help you open your eyes to a new perspective on the presidential election, it serves its purpose. You can tell at a glance which side is winning this thing, and why.
8/3/08
| [+/-] |
More On Those Maps |

Resurrecting the the electoral maps I used in 2004 to measure what the state of the race is now got me wondering if any new work had been done along these lines. The first place to start, naturally was my archives at my old Blogdrive blog to trace back this "cartogram" to its creator, Geography Professor Dr. Sara Fabrikant at UC Santa Barbara, who looked at the maps of the US colored red and blue on her television (mostly red) the day after the 2000 election and couldn't understand how the pundits could call the race close, even though it was oh, so damn close. Yet the map was a sea of red.
The problem of course was that every news outlet took maps designed to show relative geographical data and used those very familiar metaphors for reality and tried to use them for a completely different purpose, counting up electoral votes. As I indicated in my post below, although the pundits are again calling this a close race, if you map people and potential electoral college votes rather than the geography of the USA, the picture becomes clearer that John McCain is in a world of hurt.
Dr. Fabrikant and a colleague were interviewed by the Santa Barbara Press right after the 2004 election, and explained their vision of the political landscape.
"The best representation of what kind of a nation we really are, contrary to the simplistically divided red vs. blue, selling Tide and Superglue country the corporate media will perpetuate for as long as they have breath, is Dr. Fabrick's county-by-county cartogram that not only distorts the geography to show population more accurately, but also shades each county varying degrees of purple based on their support for Bush or Kerry last time around.It's actually communicating information about acres, not voters," said Daniel Montello, a UCSB geography professor.
All maps are distortions of reality, said Mr. Montello, who studies how people perceive space and geography. The earth is round and land masses are difficult to accurately draw on a two-dimensional plane. But different maps serve different purposes.
For Mr. Montello, who has a doctorate in psychology and serves as the chairman of the university's Cognitive Science Program, the meaning a map conveys is important.
The red of giant western states like Wyoming, with its population of less than 500,000, dominates the electoral map used by most newspapers.
But try and find the blue dot of the District of Columbia, which has close to 600,000 people. There are more people in a few blocks of New York City than the whole state of North Dakota, but you would probably have an easier time finding Bismarck than the Bronx in most of the national maps used to chart the election.
There are some notable exceptions to that rule. Both the New York Times and the Los Angeles Times this week have included different maps to chart such things as the depth of support for each candidate in each county across the nation. And both papers have included maps that distort the shape of states, enlarging and shrinking them based on their electoral votes.
It is ironic that distorted maps can actually convey more meaning than the standard representations of the United States, said Sara Fabrikant, a geography professor at UCSB.
Ms. Fabrikant created her first election map the day after the 2000 presidential election. The Swiss native wanted to understand the close race. She was perplexed by the message that the election was too close to call, yet the election maps used on television and in the newspapers showed a nation colored mostly Republican red.
"I'm not an American citizen and I didn't understand the electoral vote system until I put it on a map," she said.
The traditional political map made it appear that President Bush was winning hands down.
"In essence they are using the wrong visual form," Ms. Fabrikant said.
Using cartograms, maps that include statistical data to add color shading or distortions in shape, she created a map based on electoral votes that showed a more even split in votes between candidate Al Gore and Mr. Bush in the 2000 race.
She did it again this year, posting her maps online the day after the race.
The distorted maps range in color from a light blue to light pink, showing both the intensity of support for each candidate and the relative number of votes each got. (One of her colleagues said the distorted national map looks slightly like an upsidedown donkey, but Ms. Fabrikant said it was pure coincidence and that she has no party affiliation.)
"What you can really see is the urban and rural contrast in voting," Ms. Fabrikant said.
The cartogram contracts the empty land and expands the populated cities.
Over the summer she delivered a paper on the 2000 race, "Blue & Red America," to a group of German academics. She's also added other variables to her maps and included a breakdown by county. What's striking is that displaying the data in different ways begs new questions. On one map she included major rivers and highways and found a line of blue snaking up the Mississippi. In another she saw an arching band of blue extending through several southern states.
The apparent patterns prompted her to wonder if the lines followed the same migration routes of blacks who moved north for jobs, or whether they simply follow urban development along the river front. Ms. Fabrikant said she would like to work more with a political scientist to investigate those patterns.
Making these maps isn't about politics, she said, but communicating information.
"Basically what has been driving cartography for 5,000 years is the acknowledgement that a picture really is worth a thousand words."

Nothing proves Barack Obama's point better than this map. There are no red States and there are no blue States. We are one big purple nation, a country of fabulous color.
8/2/08
| [+/-] |
Maps? I Got Yer Maps |
Electoral vote: 286 251
States carried: 31 19+DC
Popular vote: 62,040,610 59,028,444
Percentage: 50.7% 48.3%

Presidential election results map. Red denotes states won by Bush/Cheney (31), Blue denotes those won by Kerry/Edwards (19+DC). The split vote in Minnesota denotes a faithless elector's vote counted for John Edwards. Each number represents the electoral votes a state gave to one candidate.
That's an awful lot of red. But it doesn't look like quite the blowout when you look at a map that truly reflects the the relative electoral college strength of each State as a function of it's size on the map, like this:

Not exactly a "mandate," is it? I started doing these in August of '04 and now is as good a time as any to put them back out there. Paul Rosenberg (who regular readers know I think is sheer genius) posted a current map of the electorate based on polling data from Polster.com that separates "strong" from "leaner" states and paints toss-up states yellow (fittingly).
By no means do I intend to duplicate Rosenberg's work here, where he makes the case that there is a "potential" for a "map changing" Obama Tsunami here based on his analysis of Swing State Clusters. But to get a feel of what he's talking about, one look at my map below should dispell the corporate media myth that this race is anywhere near close right now.
(Oooh, The Colors!)
All the usual caveats apply of course, but if the McCain camp is looking at anything close to what this map represents, it certainly explains why they suddenly look like they're desperate, trying absolutely anything they can to move the numbers.
They're acting desperate because they are desperate.
All 10 Toss-up States (yellow) were Bush States in '04, three of the "lean Obama" States (Ohio, Iowa and New Mexico) were in Bush's column too. Meanwhile, Obama is not losing a single State to the Toss-up category that John Kerry won or any leaners to McCain.
Remember, if only one or two States had flipped in either 2000 or 2004, the Democrats would have won. McCain must hold his base States and solidify his lead in all his Leaners, turn ALL the Toss-ups red and pick off either Ohio or a combination of Michigan and one of the other States Obama counts as leaning his way. To call that a tall order is the understatement of the year.


 Subscribe via Email


